


2018 School Spending Survey Report
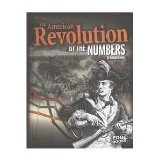
The American Revolution by the Numbers
9781491442944.
ea vol: 32p. (America at War by the Numbers). chron. further reading. glossary. maps. index. photos. websites. Capstone/Edge Bks. 2015. Tr. $27.32.
COPY ISBN
This book relies on graphics superimposed on color photos to give quantifying information about troops, military weapons, key figures, equipment, battles, the Holocaust, and the aftermath of the war as a whole. The chaotic design and lack of much context for the numbers make the organization seem arbitrary and the presentation frustrating to follow. "Critical Thinking Using the Common Core" questions appended. Reading list. Glos., ind.
ALREADY A SUBSCRIBER? LOG IN
We are currently offering this content for free. Sign up now to activate your personal profile, where you can save articles for future viewing
ALREADY A SUBSCRIBER? LOG IN
Thank you for visiting.
We’ve noticed you are using a private browser. To continue, please log in or create an account.

Be the first reader to comment.
Comment Policy:
Comment should not be empty !!!