

2018 School Spending Survey Report
Media Bias Chart | Reference Database Review
It’s imperative to make students aware that not all information sources are created equal. The Media Bias Chart, a name now trademarked by creator Ad Fontes Media (AFM), has answered this call with a systematic analysis and rating system for news and “news-like” sources, distilled into an easily shareable infographic.
Grade Level Gr 6 Up
Cost The basic Media Bias Chart is free; pricing for the enhanced educator version depends on student enrollment. Live demos or more information is available at www.adfontesmedia.com or by email at info@adfontesmedia.com.
Overview Sources for information have proliferated in the last decade, and polarization of coverage and cries of “fake news” and media bias continue to grab headlines. It’s imperative to make students aware that not all information sources are created equal. The Media Bias Chart, a name now trademarked by creator Ad Fontes Media (AFM), has answered this call with a systematic analysis and rating system for news and “news-like” sources, distilled into an easily shareable infographic. The free downloadable Media Bias Chart 7.0 allows users to see individual articles and ratings and isolate up to five sources. AFM also offers an educator pro version, with twice as many sources, filtering tools, downloadable source options, and the SUMMA News Literacy Curriculum.
Methodology AFM relies on paid three-person review teams of individuals who self-identify across the political spectrum and who read multiple articles from each source. Using AFM’s Content Analysis Rating Tool (CART), reviewers assign numerical scores on eight factors and reach consensus for a final score. An algorithm positions the media source on the Media Bias Chart. One criticism of the chart is that it places centrist publications toward the top middle, which, at a glance, gives more weight to mainstream media sources. Sources with more biased views can have just as much value; presenting the chart to students, without discussion, can perpetuate the status quo, with a predominantly white, male, business-oriented outlook.
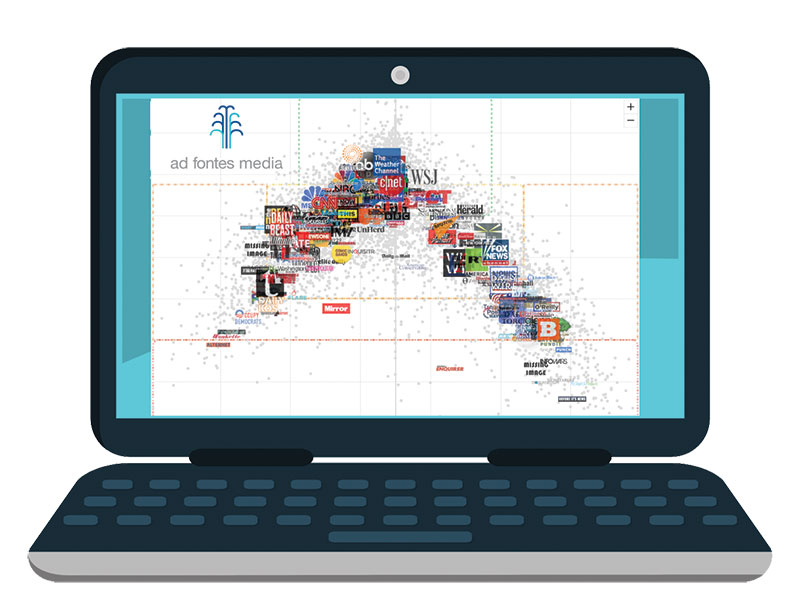
Content and visual appeal The free Media Bias Chart is an infographic, updated several times a year. To date, almost 15,000 articles, in print and online, have been placed on the chart. The vertical axis indicates source reliability; the horizontal axis, bias. An eye-catching graphic of source logos is scattered in a bell curve, with the AP, BBC, and WSJ front and center, and Wonkette and Infowars near the bottom left and right, respectively. News-oriented and factual stories appear toward the top, with low-ranking “nonsense” at the bottom. Politically liberal stories skew to the left, while conservative political coverage is grouped to the right.
Subscribers to Interactive Media Bias Chart Pro see twice as many rated sources and can filter to isolate a single source for analysis; there’s no limit on how many sources they can search for. Pro users can also create and download custom charts.
Educator resources Educators can use the static chart as a starting point for discussion for projects on news sources or to make a case for the validity of a particular source. Younger students can quickly be alerted to untrustworthy sources, while older students may be ready to dive into discussion of how to separate fact from opinion, and when bias is or is not a barrier to the worthiness of a news source.
The SUMMA curriculum is robust and engaging, and educators can adjust the lessons to fit the available time. SUMMA teaches students to use the Content Analysis Rating Tool to score articles along a numerical continuum in categories including language, political position, headlines, and graphics, in the same way that paid analysts rate articles for the Media Bias Chart. Students can work solo or in groups, discuss why they chose certain scores, and then create their own charts (and compare their rankings against those of the Media Bias Chart).
Educators can create student accounts, assign articles (new articles are provided by AFM regularly), and monitor student engagement and progress. The SUMMA curriculum allows for discussion of strengths and weaknesses of news sources and who gets to judge what “better” means as students learn to look deeper than “clickbait” headlines and attention-grabbing statements.
Verdict The visually appealing Media Bias Chart provides a handy “use this, not that” reference point for budding researchers. Delving deeper, the SUMMA curriculum helps educators teach students to analyze articles and sources, developing reasoning skills for real-world source appraisal. Ideally, classroom use of the Media Bias Chart will not imply that top-center sources are better than others in every way, but will acknowledge that top-center sources are ranked higher for accuracy and lack of bias.
Maggie Knapp, Trinity Valley Sch., Fort Worth, TX

Added To Cart
RELATED


RECOMMENDED
CAREERS
The job outlook in 2030: Librarians will be in demand
CAREERS
The job outlook in 2030: Librarians will be in demand
ALREADY A SUBSCRIBER? LOG IN
We are currently offering this content for free. Sign up now to activate your personal profile, where you can save articles for future viewing
ALREADY A SUBSCRIBER? LOG IN
Thank you for visiting.
We’ve noticed you are using a private browser. To continue, please log in or create an account.

Add Comment :-
Be the first reader to comment.
Comment Policy:
Comment should not be empty !!!